Our workflow starts with plans for a project, and usually ends with a published manuscript. Between these two concrete ends points, however, is a (seemingly vast) stretch of project development. As you work through the intermediate steps, it’s helpful to have something to remind yourself of the current state of the analyses, quickly share results with collaborators (who might have a range of comfort levels looking over code), write grant progress reports, etc.
That’s where the project report file comes in. There’s a Reports directory within the Output section of the project folder. The .Rmd file found there should be used to generate the reports / summaries. This file is already formatted to do a couple useful things.
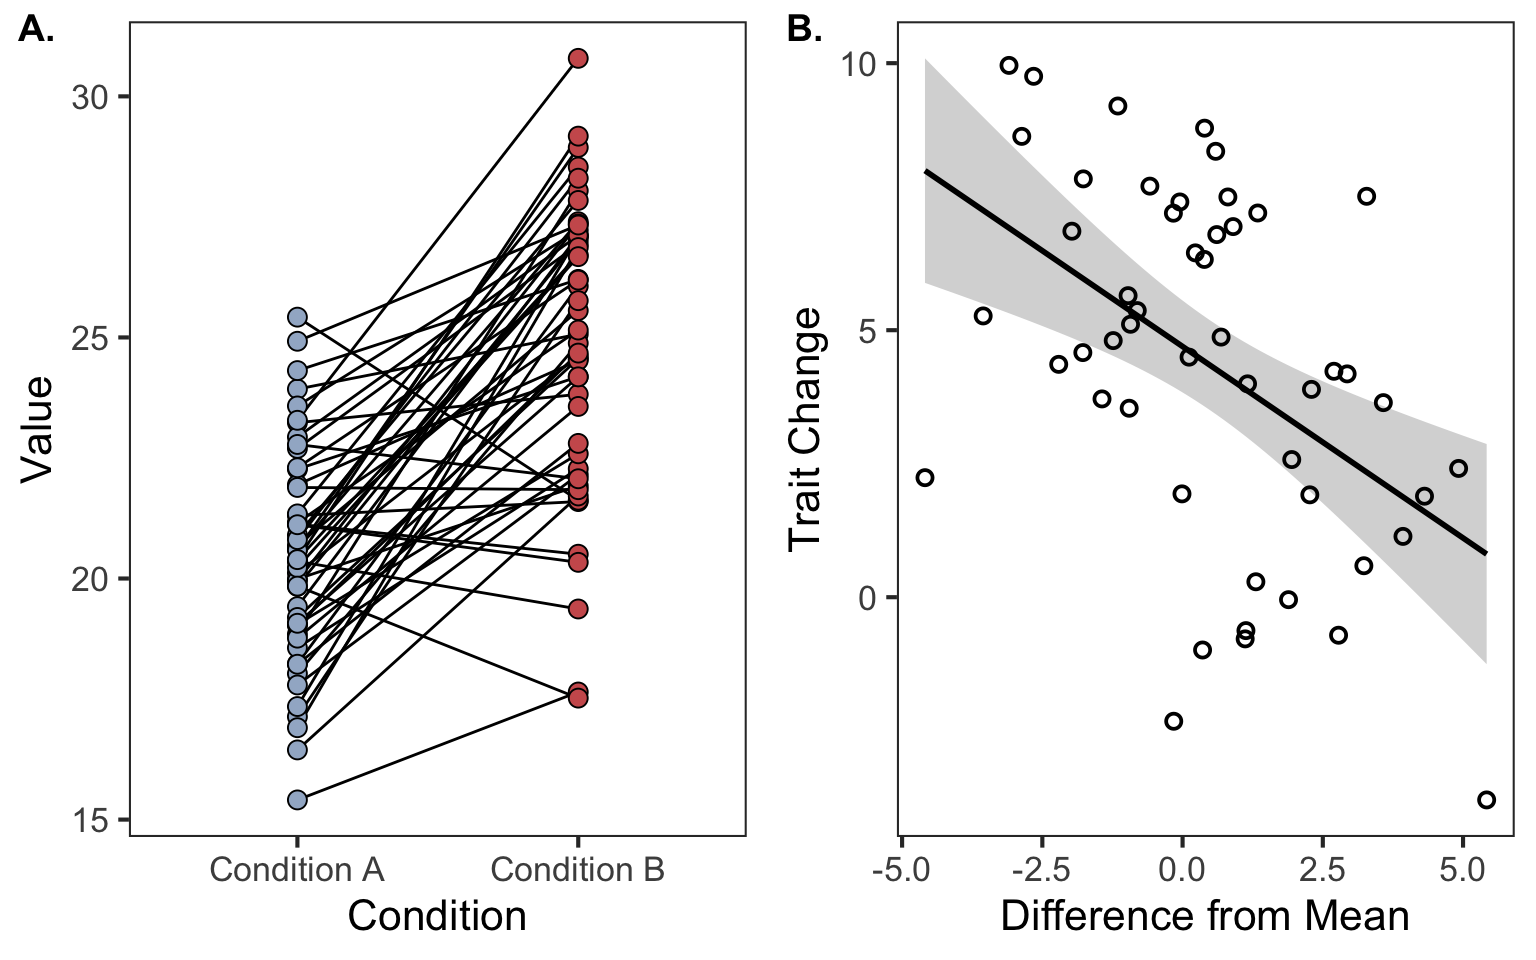
First, when it’s knit (using the controller script) it will output both an HTML and a markdown file. The markdown file will display nicely on the GitHub repo, providing a nice virtual format to share updated results. The HTML file won’t display nicely on the GitHub, but it is an easier document to share with collaborators. In addition to some aesthetic elements that make it easier to navigate (e.g. the table of contents along the side rather than the top of the document), the HTML also includes code folding and some other helpful elements. Take the following figure, for example. You’ll see a small button labeled “Code” just above it. Clicking this will reveal the code used to generate the figure. This is particularly useful when sharing code with several collaborators. Chances are, not all collaborators will care to see a project report that’s been swamped by code; many would rather just see the figures and some concise text contextualizing and summarizing the results. The code folding allows you to satisfy these collaborators along with those people who might actually care to check over the code as well.
The other useful thing the report.Rmd file will do is automatically export image files (in .pdf and .png formats) to the Output/Figures/ directory. This makes it easier to pull up-to-date figures for presentations, progress reports, and the manuscript draft. The last use is especially important - being able to include figures in the manuscript from files instead of having to run code each time you knit the document will save you a lot of time.
You should feel free to duplicate the report.Rmd file - making a separate report for different purposes, for example. This will allow extra flexibility with the content, format, and output. If you do generate multiple reports, be sure to update the file path you send figures to, otherwise you’ll overwrite the figures from your other reports! You could also prevent a report from saving image files by changing the chunk options (see the code chunk below).
Code
#These are the options set at the beginning of the report.Rmd fileknitr::opts_chunk$set(echo = knitr::is_html_output(),fig.align ="center",fig.path ="../Figures/markdown/", # Update this for each report - OR - Remove this line and...dev =c("png", "pdf"), # ...this line to prevent the figures from being savedmessage =FALSE,warning =FALSE,collapse = T)